Resource

NIE Network Capacity map

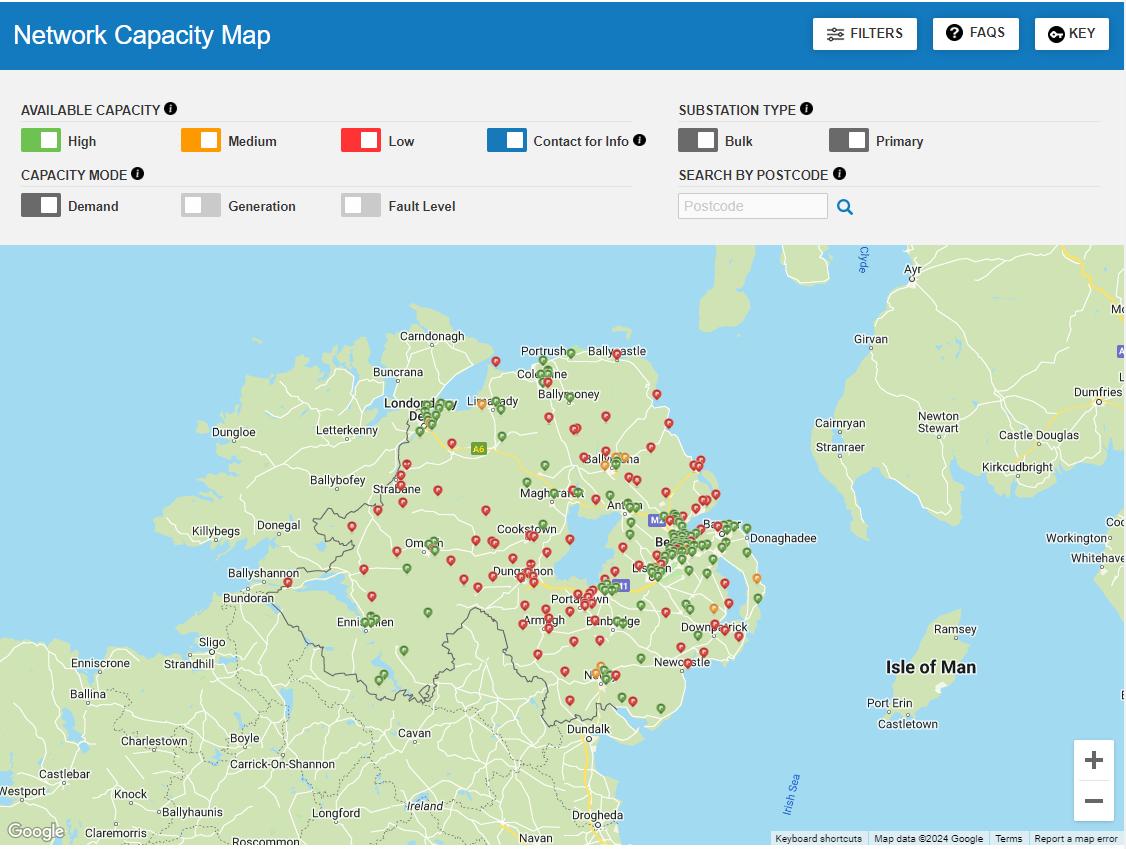
We have developed the network capacity map to assist you with connections applications at the primary substation level of the distribution network.

Data visualisation
Spatial data

This resource is part of a collection

Print Email Share URL LinkedIn
Applications for new connections are currently suspended while works are being carried out to restore power following Storm Eowyn.

The network capacity map provides an indication of the networks capability to connect loads greater than 200 Amps and generators applying under G99 to major substations. This map gives constraints down to primary substation level only. Visit Connections for more information on costs or to apply for a connection. The colour gradings are intended to guide the user to areas of the network where a connection is more likely to be achieved without significant reinforcement. The main points to note regarding the map are:

  • The data on this map is provided as an indication only and is subject to change.
  • Available demand capacity figures are based on peak winter network demands for 2022/2023 which are recorded between November and March each year.
  • Reverse power headroom is calculated using generation application queue information as of July 2023, incorporating both connected generation and committed to connect generation.
  • Available fault level capacity figures are based on the lower of either the make or break fault level ratings at each individual site as of Winter 2022/2023.
  • 33kV network availability does not infer availability on the lower voltage levels; therefore, there may be reinforcement costs associated with connection to the 11kV, 6.6kV and low voltage network.
  • In some cases the available capacity shown may already be contracted to individual customers but is not currently being fully utilised.
  • Connections to the substations with an overall RED classification are still possible; however, there might be a requirement for significant network reinforcement to overcome the impact on the network constraints.
  • The post code search functionality will display a pin at the postcode which was entered. In some cases the postcode may not be supplied by the geographically closest substation.
  • A number of primary substation capacities are interdependent on other substations or circuit capacities. Where applicable this is stated within the “Show Information Window”.
  • This capacity map illustrates indicative distribution capacity only and does not represent the availability of transmission capacity at each node.

Spreadsheet Version

There is a spreadsheet version of the data in a Microsoft Excel spreadsheet format available to download.


End of Preview

Register to access the full article

Designed to aid Local Authorities in developing robust, evidence-based plans to enable Net Zero.

Register now

Already have an account? Login

Free UK Local Authority access

Register now
  • Guest preview of selected publicly available resources
  • Full library of 1,000+ articles
  • CPD accredited e-learning courses
  • Case studies
  • Discussion forum